class: center, middle, inverse, title-slide # animation ### 2021-10-21 --- class: middle, inverse # Welcome --- ## Announcements - HW 4 due Wednesday (but will accept until Thursday noon without penalty) - Monday lab: - Tips for project workflow + organization - Scheduling team meetings - Time to work on proposals and/or HW 4 - https://twitter.com/kjhealy/status/1451264212903288834?s=20 - Webinar opportunity - Thank you notes + ugly ggplots! --- ## Setup .midi[ ```r # load packages library(tidyverse) library(readxl) library(gganimate) library(datasauRus) library(knitr) library(kableExtra) library(transformr) library(palmerpenguins) # set default theme for ggplot2 ggplot2::theme_set(ggplot2::theme_minimal(base_size = 16)) # set default figure parameters for knitr knitr::opts_chunk$set( fig.width = 8, fig.asp = 0.618, fig.retina = 3, dpi = 300, out.width = "60%" ) # dplyr print min and max options(dplyr.print_max = 10, dplyr.print_min = 10) ``` ] --- class: middle, inverse # Animation --- ## Philosophy - The purpose of interactivity is to display more than can be achieved with persistent plot elements, and to invite the reader to engage with the plot. - Animation allows more information to be displayed, but developer keeps control - Beware that it is easy to forget what was just displayed, so keeping some elements persistent, maybe faint, can be useful for the reader --- ## **gganimate** .pull-left[ - **gganimate** extends the grammar of graphics as implemented by ggplot2 to include the description of animation - It provides a range of new grammar classes that can be added to the plot object in order to customize how it should change with time ] .pull-right[ <img src="images/gganimate.png" width="40%" /> ] --- ## Animation example <img src="15-animation_files/figure-html/freedom-race-1.gif" width="80%" /> --- ## How does gganimate work? - Start with a ggplot2 specification - Add layers with graphical primitives (geoms) - Add formatting specification - Add animation specification --- ## A simple example .pull-left[ ```r *ggplot( * freedom_ranked %>% filter(country == "Turkey") * ) ``` ] .pull-right[ <img src="15-animation_files/figure-html/unnamed-chunk-3-1.png" width="100%" /> ] --- ## A simple example .pull-left[ ```r ggplot( freedom_ranked %>% filter(country == "Turkey"), * aes(x = year, y = civil_liberty) ) ``` ] .pull-right[ <img src="15-animation_files/figure-html/unnamed-chunk-4-1.png" width="100%" /> ] --- ## A simple example .pull-left[ ```r ggplot( freedom_ranked %>% filter(country == "Turkey"), aes(x = year, y = civil_liberty) ) + * geom_line() ``` ] .pull-right[ <img src="15-animation_files/figure-html/unnamed-chunk-5-1.png" width="100%" /> ] --- ## A simple example .pull-left[ ```r ggplot( freedom_ranked %>% filter(country == "Turkey"), aes(x = year, y = civil_liberty) ) + geom_line() + * labs( * x = "Year", y = "Civil liberty score", * title = "Turkey's civil liberty score" * ) ``` ] .pull-right[ <img src="15-animation_files/figure-html/unnamed-chunk-6-1.png" width="100%" /> ] --- ## A simple example .pull-left[ ```r ggplot( freedom_ranked %>% filter(country == "Turkey"), aes(x = year, y = civil_liberty) ) + geom_line() + labs( x = "Year", y = "Civil liberty score", title = "Turkey's civil liberty score" ) + * transition_reveal(year) ``` ] .pull-right[ <img src="15-animation_files/figure-html/anim-5-1.gif" width="100%" /> ] --- class: middle, inverse # Grammar of animation --- ## Grammar of animation - Transitions: `transition_*()` defines how the data should be spread out and how it relates to itself across time -- - Views: `view_*()` defines how the positional scales should change along the animation -- - Shadows: `shadow_*()` defines how data from other points in time should be presented in the given point in time -- - Entrances/Exits: `enter_*()`/`exit_*()` defines how new data should appear and how old data should disappear during the course of the animation -- - Easing: `ease_aes()` defines how different aesthetics should be eased during transitions --- ## Transitions How the data changes through the animation. <table class="table" style="font-size: 26px; margin-left: auto; margin-right: auto;"> <thead> <tr> <th style="text-align:left;"> Function </th> <th style="text-align:left;"> Description </th> </tr> </thead> <tbody> <tr> <td style="text-align:left;"> transition_manual </td> <td style="text-align:left;"> Build an animation frame by frame (no tweening applied). </td> </tr> <tr> <td style="text-align:left;"> transition_states </td> <td style="text-align:left;"> Transition between frames of a plot (like moving between facets). </td> </tr> <tr> <td style="text-align:left;"> transition_time </td> <td style="text-align:left;"> Like transition_states, except animation pacing respects time. </td> </tr> <tr> <td style="text-align:left;"> transition_components </td> <td style="text-align:left;"> Independent animation of plot elements (by group). </td> </tr> <tr> <td style="text-align:left;"> transition_reveal </td> <td style="text-align:left;"> Gradually extends the data used to reveal more information. </td> </tr> <tr> <td style="text-align:left;"> transition_layers </td> <td style="text-align:left;"> Animate the addition of layers to the plot. Can also remove layers. </td> </tr> <tr> <td style="text-align:left;"> transition_filter </td> <td style="text-align:left;"> Transition between a collection of subsets from the data. </td> </tr> <tr> <td style="text-align:left;"> transition_events </td> <td style="text-align:left;"> Define entrance and exit times of each visual element (row of data). </td> </tr> </tbody> </table> --- ## Transitions .task[ Which transition was used in the following animations? ] .pull-left[ <img src="15-animation_files/figure-html/transition-layers-1.gif" width="100%" /> ] -- .pull-right[ `transition_layers()` New layers are being added (and removed) over the dots. ] --- ## Views How the plot window changes through the animation. <table class="table" style="font-size: 26px; margin-left: auto; margin-right: auto;"> <thead> <tr> <th style="text-align:left;"> Function </th> <th style="text-align:left;"> Description </th> </tr> </thead> <tbody> <tr> <td style="text-align:left;"> view_follow </td> <td style="text-align:left;"> Change the view to follow the range of current data. </td> </tr> <tr> <td style="text-align:left;"> view_step </td> <td style="text-align:left;"> Similar to view_follow, except the view is static between transitions. </td> </tr> <tr> <td style="text-align:left;"> view_step_manual </td> <td style="text-align:left;"> Same as view_step, except view ranges are manually defined. </td> </tr> <tr> <td style="text-align:left;"> view_zoom </td> <td style="text-align:left;"> Similar to view_step, but appears smoother by zooming out then in. </td> </tr> <tr> <td style="text-align:left;"> view_zoom_manual </td> <td style="text-align:left;"> Same as view_zoom, except view ranges are manually defined. </td> </tr> </tbody> </table> --- ## Views .task[ Which view was used in the following animations? ] .pull-left[ <img src="15-animation_files/figure-html/view-follow-1.gif" width="100%" /> ] -- .pull-right[ `view_follow()` Plot axis follows the range of the data. ] --- ## Shadows How the history of the animation is shown. Useful to indicate speed of changes. <table class="table" style="font-size: 26px; margin-left: auto; margin-right: auto;"> <thead> <tr> <th style="text-align:left;"> Function </th> <th style="text-align:left;"> Description </th> </tr> </thead> <tbody> <tr> <td style="text-align:left;"> shadow_mark </td> <td style="text-align:left;"> Previous (and/or future) frames leave permananent background marks. </td> </tr> <tr> <td style="text-align:left;"> shadow_trail </td> <td style="text-align:left;"> Similar to shadow_mark, except marks are from tweened data. </td> </tr> <tr> <td style="text-align:left;"> shadow_wake </td> <td style="text-align:left;"> Shows a shadow which diminishes in size and/or opacity over time. </td> </tr> </tbody> </table> --- ## Shadows .task[ Which shadow was used in the following animations? ] .pull-left[ <img src="15-animation_files/figure-html/shadow-wake-1.gif" width="100%" /> ] -- .pull-right[ `shadow_wake()` The older tails of the points shrink in size, leaving a "wake" behind it. ] --- ## Shadows .task[ Which shadow was used in the following animations? ] .pull-left[ <img src="15-animation_files/figure-html/shadow-mark-1.gif" width="100%" /> ] -- .pull-right[ `shadow_mark()` Permanent marks are left by previous points in the animation. ] --- ## Entrances and exits How elements of the plot appear and disappear. <table class="table" style="font-size: 26px; margin-left: auto; margin-right: auto;"> <thead> <tr> <th style="text-align:left;"> Function </th> <th style="text-align:left;"> Description </th> </tr> </thead> <tbody> <tr> <td style="text-align:left;"> enter_appear/exit_disappear </td> <td style="text-align:left;"> Poof! Instantly appears or disappears. </td> </tr> <tr> <td style="text-align:left;"> enter_fade/exit_fade </td> <td style="text-align:left;"> Opacity is used to fade in or out the elements. </td> </tr> <tr> <td style="text-align:left;"> enter_grow/exit_shrink </td> <td style="text-align:left;"> Element size will grow from or shrink to zero. </td> </tr> <tr> <td style="text-align:left;"> enter_recolor/exit_recolor </td> <td style="text-align:left;"> Change element colors to blend into the background. </td> </tr> <tr> <td style="text-align:left;"> enter_fly/exit_fly </td> <td style="text-align:left;"> Elements will move from/to a specific x,y position. </td> </tr> <tr> <td style="text-align:left;"> enter_drift/exit_drift </td> <td style="text-align:left;"> Elements will shift relative from/to their x,y position. </td> </tr> <tr> <td style="text-align:left;"> enter_reset/exit_reset </td> <td style="text-align:left;"> Clear all previously added entrace/exits. </td> </tr> </tbody> </table> --- ## Animation controls How data moves from one position to another. ```r p + ease_aes({aesthetic} = {ease}) p + ease_aes(x = "cubic") ``` [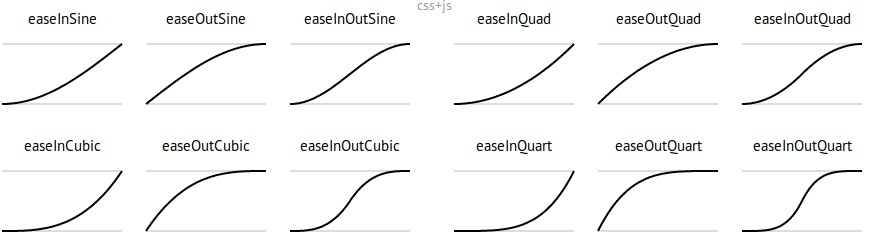](https://easings.net/) .footnote[ Source: https://easings.net/ ] --- class: middle, inverse # Deeper dive --- ## A not-so-simple example, the datasaurus dozen Pass in the dataset to ggplot .pull-left[ ```r *ggplot(datasaurus_dozen) ``` ] .pull-right[ <img src="15-animation_files/figure-html/unnamed-chunk-8-1.png" width="100%" /> ] --- ## A not-so-simple example, the datasaurus dozen For each dataset we have x and y values, in addition we can map dataset to color .pull-left[ ```r ggplot(datasaurus_dozen, * aes(x, y, color=dataset)) ``` ] .pull-right[ <img src="15-animation_files/figure-html/unnamed-chunk-9-1.png" width="100%" /> ] --- ## A not-so-simple example, the datasaurus dozen Trying a simple scatter plot first, but there is too much information .pull-left[ ```r ggplot(datasaurus_dozen, aes(x, y, color = dataset)) + * geom_point() ``` ] .pull-right[ <img src="15-animation_files/figure-html/unnamed-chunk-10-1.png" width="100%" /> ] --- ## A not-so-simple example, the datasaurus dozen We can use facets to split up by dataset, revealing the different distributions .pull-left[ ```r ggplot(datasaurus_dozen, aes(x, y, color = dataset)) + geom_point() + * facet_wrap(~dataset) ``` ] .pull-right[ <img src="15-animation_files/figure-html/unnamed-chunk-11-1.png" width="100%" /> ] --- ## A not-so-simple example, the datasaurus dozen We can just as easily turn it into an animation, transitioning between dataset states! .pull-left[ ```r ggplot(datasaurus_dozen, aes(x, y)) + geom_point() + * transition_states(dataset, 3, 1) + * labs(title = "Dataset: {closest_state}") ``` ] .pull-right[ <img src="15-animation_files/figure-html/unnamed-chunk-12-1.gif" width="100%" /> ] --- class: middle, inverse # Tips --- ## Animation options Sometimes you need more frames, sometimes fewer - Save plot object, and use `animate()` with arguments like - `nframes`: number of frames to render (default 100) - `fps`: framerate of the animation in frames/sec (default 10) - `duration`: length of the animation in seconds (unset by default) - etc. -- - In R Markdown, specify the arguments to `animate()` in the chunk options when using `gganimate`, e.g. `{r, gganimate = list(nframes = 50, fps = 20)}` -- - Learn more at https://gganimate.com/reference/animate.html --- ## Considerations in making effective animations - Pace: speed of animation Quick animations may be hard to follow. Slow animations are boring and tedious. -- - Perplex: amount of information It is easy for animations to be overwhelming and confusing. Multiple simple animations can be easier to digest. -- - Purpose: Usefulness of using animation Is animation needed? Does it provide additional value? --- class: middle .large[ .hand[ livecoding ] ] (See next slide for code developed during live coding session) --- ## Data wrangling .midi[ ```r freedom <- read_csv(here::here("15-animation", "data/freedom.csv"), na = "-") freedom_to_plot <- freedom %>% rowwise() %>% mutate(sd = sd(c_across(contains("cl_")), na.rm = TRUE)) %>% ungroup() %>% arrange(desc(sd)) %>% relocate(country, sd) %>% slice_head(n = 15) %>% drop_na() freedom_ranked <- freedom_to_plot %>% select(country, contains("cl_")) %>% pivot_longer( cols = -country, names_to = "year", values_to = "civil_liberty", names_prefix = "cl_", names_transform = list(year = as.numeric) ) %>% group_by(year) %>% mutate(rank_in_year = rank(civil_liberty, ties.method = "first")) %>% ungroup() %>% mutate(is_turkey = if_else(country == "Turkey", TRUE, FALSE)) ``` ] --- ## Faceted plot ```r freedom_faceted_plot <- freedom_ranked %>% ggplot(aes(x = civil_liberty, y = factor(rank_in_year))) + geom_col(aes(fill = is_turkey), show.legend = FALSE) + scale_fill_manual(values = c("gray", "red")) + facet_wrap(~year) + scale_x_continuous( limits = c(-5, 7), breaks = 1:7 ) + geom_text( hjust = "right", aes(label = country), x = -1 ) + theme( panel.grid.major.y = element_blank(), panel.grid.minor.y = element_blank(), panel.grid.minor.x = element_blank(), axis.text.y = element_blank() ) + labs(x = NULL, y = NULL) ``` --- ## Animated plot ```r freedom_bar_race <- freedom_faceted_plot + facet_null() + geom_text( x = 5, y = 1, hjust = "left", aes(label = as.character(year)), size = 10 ) + aes(group = country) + transition_time(as.integer(year)) + labs( title = "Civil liberties rating, {frame_time}", subtitle = "1: Highest degree of freedom - 7: Lowest degree of freedom" ) animate(freedom_bar_race, nframes = 30, fps = 2) ``` --- ## Acknowledgements - [Getting your plots to talk back by Di Cook](http://emitanaka.org/datavis-workshop-ssavic/slides/day2-session3.pdf) - [gganimate workshop by Mitchell O'Hara-Wild](https://github.com/numbats/gganimate-workshop) ---